Monday, October 23, 2017

mini-lab: Identify Compounds _ Lawton Corrigan

Today in Mr. Wong's chemistry class we got to try and figure out what substances we were burning based on the color of the flame, here are my guesses and pictures:

After these elements were burned, we were asked to analyze the colors and attempt to identify the element. Here is what we thought:
Substance #1 when heated showed a orange greenish flame at first, which turned into a bluish green flame after a few seconds. 
Substance #2 above gave of a bright orange color.
When burning substance #3 (above) it also gave off a distinct orange coloration. 
Substance #4 (above) was interesting because it gave a greenish, reddish, and even purplish color. 
Substance #5 shown above had an reddish orange coloration. 
Finally, substance #6 was pretty red for a decent amount of time before slowly turning into a more orange green combination. 
Lab questions:
Think Critically: How can the single electron in a hydrogen atom produce all of the lines found in its emission spectrum?
When an electron becomes excited, in this case because of the heat energy, the electron travels across levels. This is a more up and down pattern which produces various coloration at different levels or heights. 
Predict: How can you predict the absorption spectrum of a solution by looking at its color?
You can predict that the absorption spectrum of a solution by seeing where the substance will peak at the wavelength of the complimentary color of the solution.   
Apply: How can spectra be used to identify the presence of specific elements in a substance?
A spectra can be used to identify the presence of specific elements in a substance because each element will produce unique colors and variations when exited with energy like heat. Those colors when observed, will help you uncover the the identity of the unknown substance. 
Error Analysis. Name a potential source of error in this experiment. Choose one of the elements you observed, and research its absorption spectrum. Compare your findings with the results of your experiment.


A major potential source of error which definitely affected my group was cross contamination of the substances on the skewer which caused similarities in the color differentiation of the flame when the substances were burnt. This made the substances sometimes indistinguishable from one another. 

Thursday, October 19, 2017

EPIC ELECTRON HAIKU - Lawton Corrigan

Below is an original Haiku style poem written by Lawton Corrigan in Mr. Wong's 6th period chemistry class:

Electrons are cool,
They have configurations,
Valence Electrons

#elctronhaiku

Monday, October 9, 2017

SNACKIUM Lab - Corrigan

On Friday, October 6th, Mr. Wong's 6th period chemistry class researched and found the different of the element Snackium. Here is my excel spreadsheet when, where you can see my findings!
Here are some pictures of all of the isotopes of Snackium!

Isotope 1

Isotope 2

Isotope 3

Isotope 4

Isotope 5

Isotope 6


Calculate 1:
Find the percent abundance of the pieces by dividing the individual piece quatity by the total number of snack pieces.
Perect abundance for isotope #:
1 = 35%
2 = 11.4%
3 = 20.3%
4 = 12.7%
5 = 13.6%
6 = 7%
Calculate 2:
Use the isotopic percent abundance of the snack pieces and the mass to calculate the total weighted atomic mass for your element "Snackium."
Total weighted average atomic mass for my Snackium: 44.89 grams
Interpret:
Explain why the total weighted average atomic mass of the element Snackium is not equal to the mass of an of the pieces totals.
This is because is an average of all the numbers and none of the numbers are exactly average.

Monday, October 2, 2017

Lab - Let's Make a Spectometer - Corrigan

On Friday the 29th of September, Mr. Wong's 6th period class engaged in building their own spectrometers. We then each found three different light sources to see and compare the verity of colors witnessed.

 Here is my spectrum created when pointing my spectrometer at the sun^, which was my first light source.
When using my spectrometer to look at ne of our LED class room lights, I noticed this particular spectrum.


Here I had a class mate direct the flashlight on his phone into my spectrometer in order to get this spectrum.


After comparing all three spectrums from the different light sources, I noticed a couple similarities and differences. First I recognized that each spectrum contains roughly the same main colors of green, red, a yellowish color, and purple. However the thickness and length of each color seemed a little different for each spectrum. This is most likely because of the different types of light that are being emitted. For example, the light in the classroom was classic LED and probably the same with the flashlight, however the sun was natural solar light. The spectrum created by the sun was much smaller and thicker while the class light spectrum was very slim and the colors spread out. The Phone light I would say is closer to the class light with color and length, but it is much choppier.

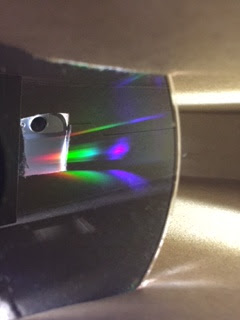
These are a few photos of what I was working with, my spectrometer.